Eyeball Method:
Simple summary reports can provide a path to tuning opportunities.
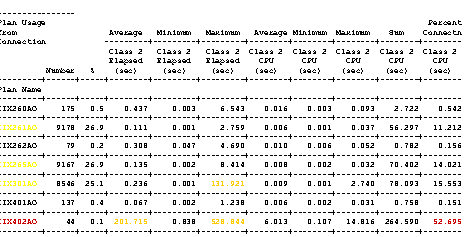
Three plans have 78.9% of the total transaction volume, and the average class 2 CPU time is very good. There is not much tuning opportunity for them. At the same time, CIX301AO does show high values as a maximum event – so this means that something happens in this program occasionally that consumes excessive resources. It might be worthwhile to track the SQL executed and determine which statement causes this problem.
However, plan CIX402AO shows 52.7% of the CPU, with only .1% of the volume. This is your tuning opportunity. Whenever this plan is executed it impacts the rest of the system.

